
CS50 final project
For my CS50 final project, I used Python to graph a shot chart of LeBron James' shots over his NBA career. The first step was to import matplotlib, pandas, seaborn and numpy into Python. We'll also want to import IPython display so we know what we're looking at.
import requests
                    import matplotlib.pyplot as plt
                    import pandas as pd
                    from IPython.display import display
                    import seaborn as sns
                    import numpy as np
                    %matplotlib inline
                    pd.set_option('display.max_columns',1000)
Fortunately, there are already a number of tutorials that go over how to make a shot chart. And, the NBA.com website has the data posted on its stats.nba.com website.
#set headers, otherwise the API may not return what we're looking for
                    HEADERS = {'user-agent': ('Mozilla/5.0(Macintosh; Intel Mac OS X 10_10_5)'
                                             'AppleWebKit/537.36(KHTML, like Gecko)'
                                             'Chrome/45.0.2454.101 Safari/537.36'),
                              'referer': 'http://stats.nba.com/scores/'
                              }
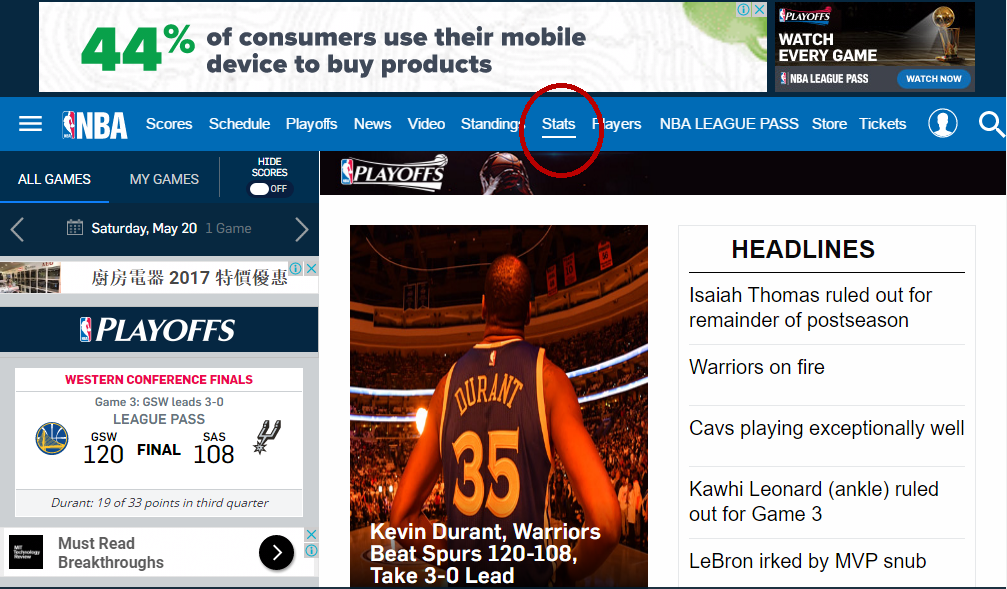
Greg Reda posted this tutorial on how to pull John Wall's shot logs from the NBA.com website. Unfortunately, the NBA changed the layout of NBA.com site since he published his tutorial in 2015. The data is still on the NBA.com website. We just needed to find it. There's a couple more steps to find the shot chart data:
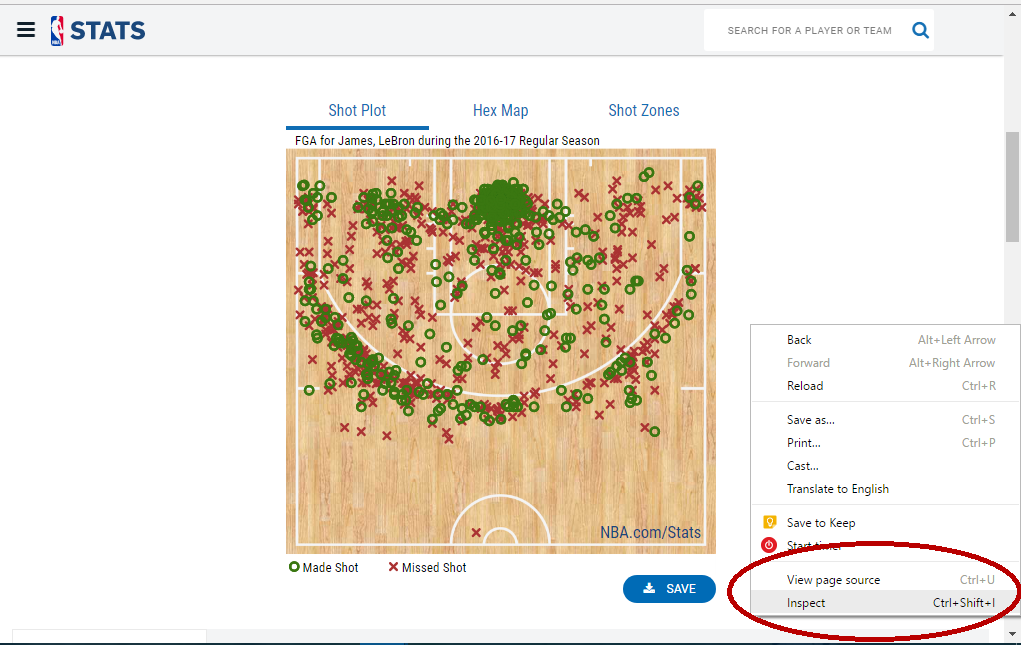
- Go to the NBA.com website and click the "Stats" link
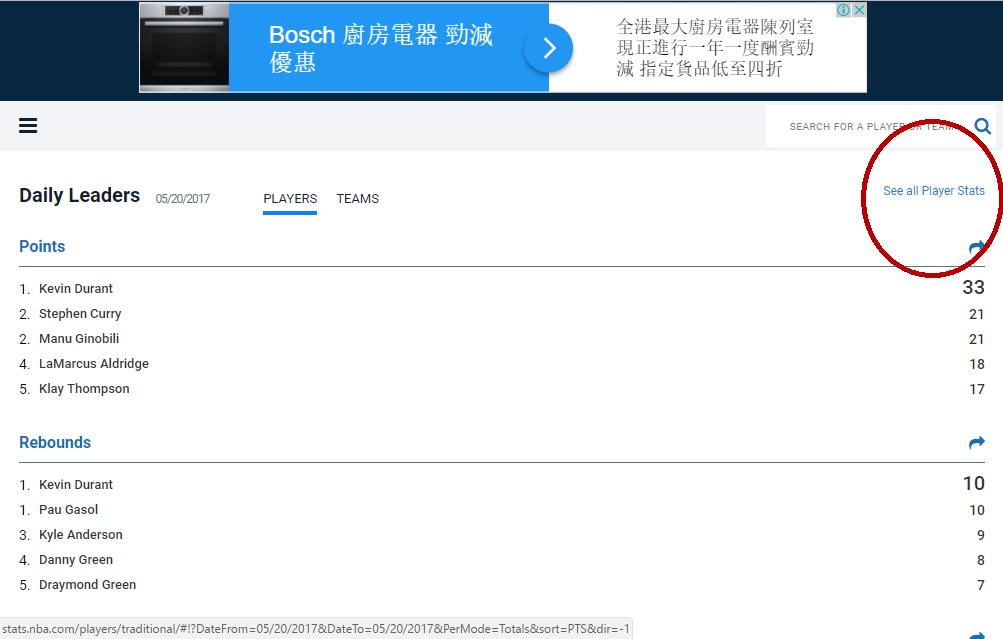
- Select the "See all Players Stats" link
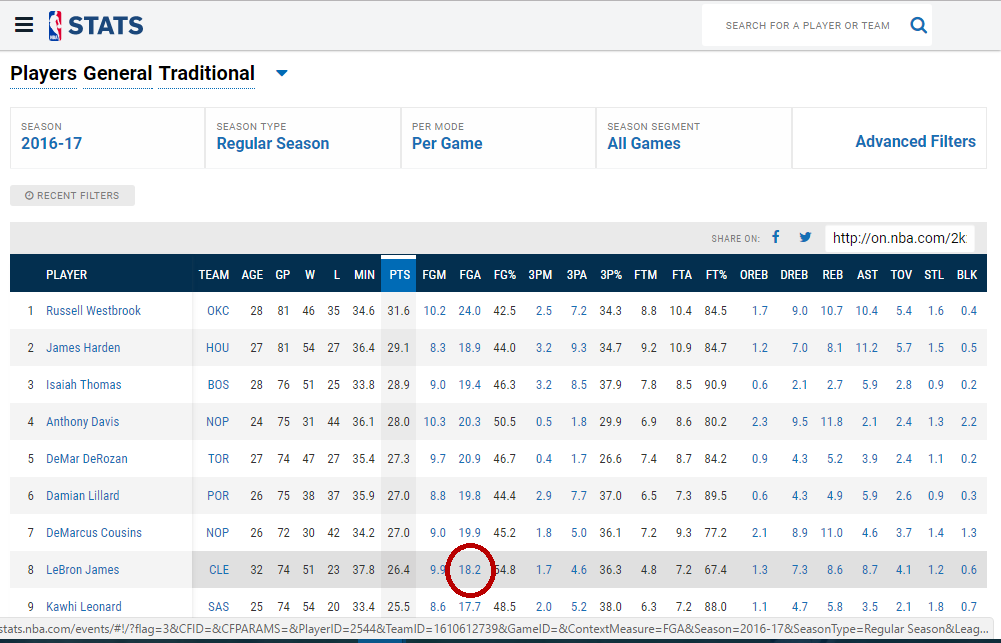
- Select the "FGA" link for the player
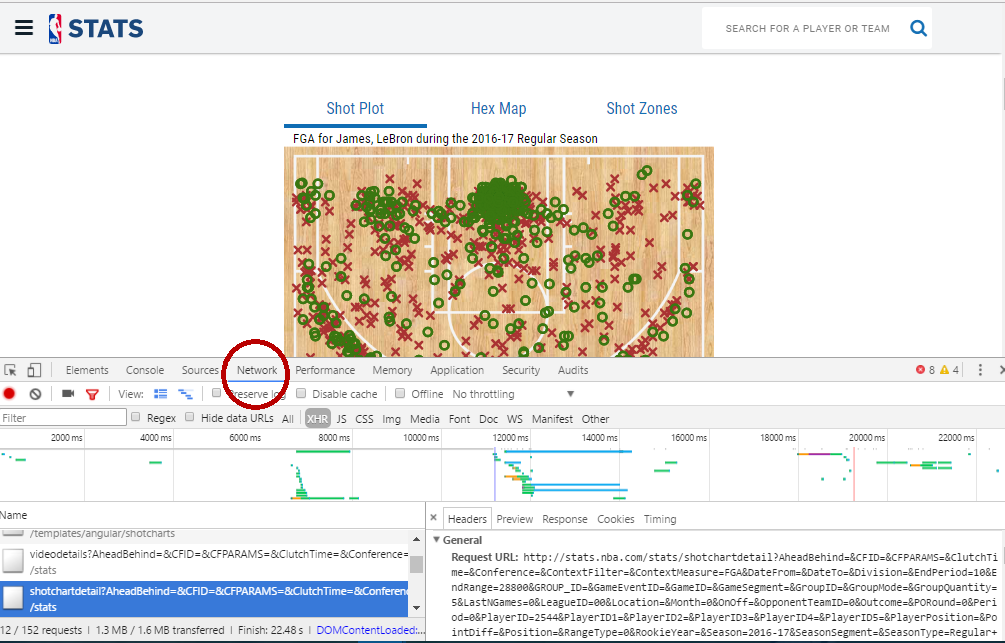
- Right click the mouse and select "Inspect"
- Select "Network"
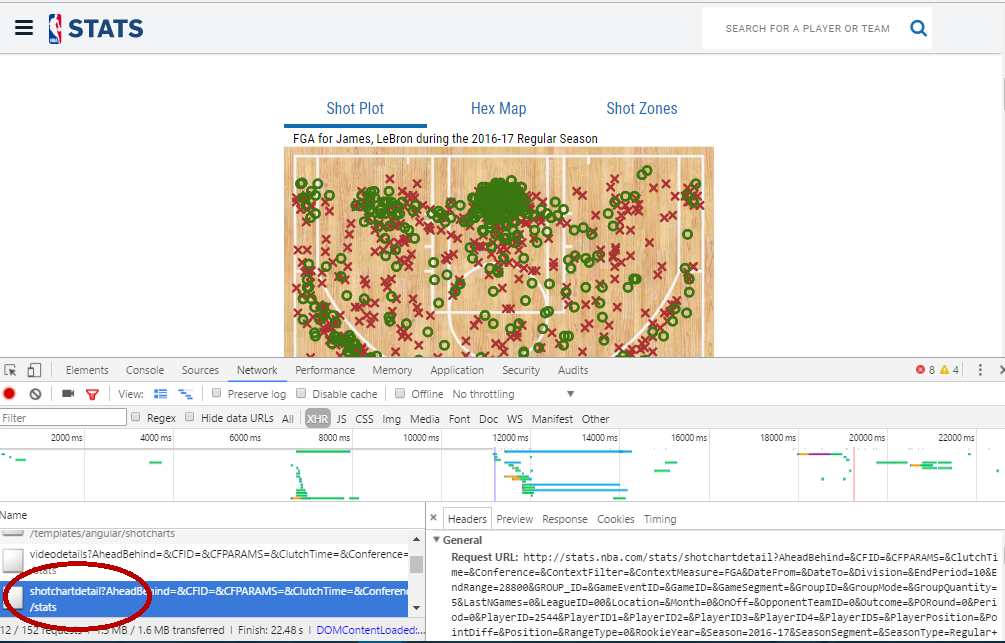
- Select the link that starts with "shotchartdetail?"
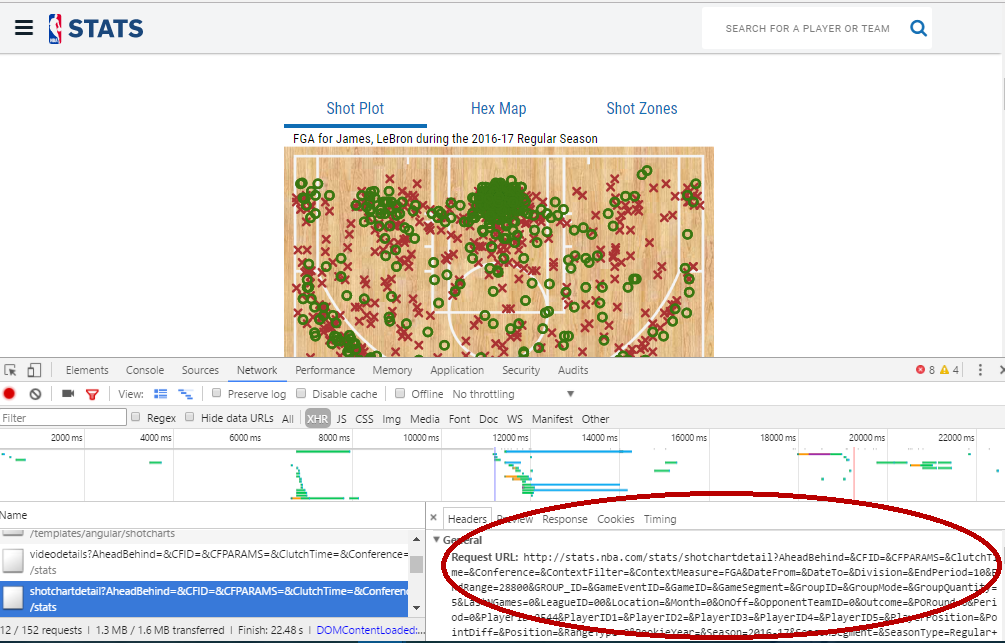
- In the "Header" tab, copy and paste the "Request URL"
Savvas Tjortjoglou has published a tutorial on how to create a shot chart using Python. I made a couple of minor changes to his code:
- Each NBA player has a player ID number. Rather than hard code LeBron James' player ID number 2544, I set the player ID number as a variable,
- Since this shot chart covers LeBron James' rookie season to the current NBA season, I created an array called "seasons" and set the range of seasons from 2003-04 season to the current 2016-17 season.
- The NBA splits each players' stats into regular season and post-season statistics. For LeBron James' career shot chart, we need to run the stats for both the regular season and post-season then add them together.
#get all of LeBron James' shots from 1996 to 2016 and put it into an array
                    playerID="2544"
                    seasons=[]
                    for season in range(2003,2016):
                        #the stats.nba.com API wants season as "1996-97"
                        seasonString = str(season) + '-' +str(season+1)[2:]

                        shot_chart_url='http://stats.nba.com/stats/shotchartdetail?CFID=33&CFPARAMS='+ seasonString +'&ContextFilter=&ContextMeasure=FGA&DateFrom=&DateTo=&GameID=&GameSegment=&LastNGames=0&LeagueID=00&Location=&MeasureType=Base&Month=0&OpponentTeamID=0&Outcome=&PORound=0&PaceAdjust=N&PerMode=PerGame&Period=0&PlayerID='+ playerID +'&PlayerPosition=&PlusMinus=N&Position=&Rank=N&RookieYear=&Season='+ seasonString +'&SeasonSegment=&SeasonType=Regular+Season&ShotClockRange=&TeamID=0&VsConference=&VsDivision='
                        response=requests.get(shot_chart_url, headers=HEADERS)

                        #split response into headers and content
                        headers=response.json()['resultSets'][0]['headers']
                        shots=response.json()['resultSets'][0]['rowSet']

                        #create pandas datafram to hold the data
                        shot_df=pd.DataFrame(shots, columns=headers)

                        #add extra column for season
                        shot_df['SEASON']=seasonString

                        #add extra column for playoff flag
                        shot_df['playoffs']=0

                        seasons.append(shot_df)

                    #playoffs stats
                    for season in range(1996,2016):
                        #the stats.nba.com API wants season as "1996-97"
                        seasonString = str(season) + '-' +str(season+1)[2:]

                        shot_chart_url='http://stats.nba.com/stats/shotchartdetail?CFID=33&CFPARAMS='+ seasonString +'&ContextFilter=&ContextMeasure=FGA&DateFrom=&DateTo=&GameID=&GameSegment=&LastNGames=0&LeagueID=00&Location=&MeasureType=Base&Month=0&OpponentTeamID=0&Outcome=&PORound=0&PaceAdjust=N&PerMode=PerGame&Period=0&PlayerID=977&PlayerPosition=&PlusMinus=N&Position=&Rank=N&RookieYear=&Season='+ seasonString +'&SeasonSegment=&SeasonType=Playoffs&ShotClockRange=&TeamID=0&VsConference=&VsDivision='

                        response=requests.get(shot_chart_url, headers=HEADERS)

                        #split response into headers and content
                        headers=response.json()['resultSets'][0]['headers']
                        shots=response.json()['resultSets'][0]['rowSet']

                        #create pandas datafram to hold the data
                        shot_df=pd.DataFrame(shots, columns=headers)

                        #add extra column for season
                        shot_df['SEASON']=str(season)+'-'+str(season+1)[2:]
                        shot_df['playoffs']=1

                        seasons.append(shot_df)
#combine all season and playoffs dataframes into one dataframe
                    all_shots=pd.concat(seasons)

                    # dump a csv file
                    #all_shots.to_csv("lebron_james_all_shots.csv")
Out of curiosity, I wanted to check how many shots LeBron James has attempted in his career.
len(all_shots)
For each shot that LeBron James has taken, the NBA assigns a number of fields (i.e. Game ID, Period, Minutes Remaining, Seconds Remaining). For the shot chart, we want to find the X- and Y-coordinates of each shot and map it on a basketball court.
all_shots.head()
Since we have the data on LeBron James' shots, I figured we could break down each shot into the categories to see how he is scoring his buckets.
#combine shot types
                    all_shots['COMBINED_SHOT_TYPE']=all_shots['ACTION_TYPE']

                    all_shots.replace(to_replace={
                            'COMBINED_SHOT_TYPE':{
                                '(.+)?Jump (.+)?(S|s)hot':'Jump Shot',
                                '(.+)?Fadeaway(.+)?':'Jump Shot',
                                '(.+)?Dunk Shot':'Dunk',
                                '(.+)?Layup (S|s)hot':"Layup",
                                '(.+)?Hook.+':"Hook Shot",
                                '(.+)?Tip.+':"Tip Shot",
                                '(.+)?Bank.+':"Bank Shot",
                                '(.+)?Finger Roll.+':"Layup"
                            }
                        }, regex=True, inplace=True)
                    all_shots.COMBINED_SHOT_TYPE.value_counts()
Next, we need to draw the basketball court. Fortunately, Savvas Tjortjoglou has done all the hard work of calculating the dimensions of a basketball court into pixels in his tutorial so we can just copy and paste the code.
#draw the court
                    from matplotlib.patches import Circle, Rectangle, Arc

                    def draw_court(ax=None, color='black', lw=2, outer_lines=False):
                        #if an axes object isn't provided to plot onto, just get current one
                        if ax is None:
                            ax = plt.gca()

                        #create the various parts of an NBA basketball court

                        #create the basketball hoop
                        #diameter of a hoop is 18" so it has a radius of 9", which is a value of 7.5 in our coordinate system
                        hoop = Circle((0,0), radius = 7.5, linewidth=lw, color=color, fill=False)

                        #create backboard
                        backboard = Rectangle((-30, -7.5), 60, -1, linewidth=lw, color=color)

                        #the paint
                        #create the outer box of the paint, width=16 ft, height=19 ft
                        outer_box = Rectangle((-80, -47.5), 160, 190, linewidth=lw, color=color, fill=False)

                        #create the inner box of the paint, width=12 ft, hieght=19ft
                        inner_box = Rectangle((-60, -47.5), 120, 190, linewidth=lw, color=color, fill=False)

                        #create the free throw top arc
                        top_free_throw=Arc((0, 142.5), 120, 120, theta1=0, theta2=180, linewidth=lw, color=color, fill=False)

                        #create the free throw bottom arc
                        bottom_free_throw=Arc((0, 142.5), 120, 120, theta1=180, theta2=0, linewidth=lw, color=color, linestyle='dashed')

                        #restricted zone, arc with 4 ft radius from center of the hoop
                        restricted=Arc((0,0), 80, 80, theta1=0, theta2=180, linewidth=lw, color=color)

                        #three point line
                        #create the side 3 point lines, 14 ft long before they before they begin to arc
                        corner_three_a = Rectangle((-220, -47.5), 0, 140, linewidth=lw, color=color)

                        corner_three_b = Rectangle((220, -47.5), 0, 140,  linewidth=lw, color=color)

                        #three point arc, center of the arc will be the hoop, arc is 23 ft 9 inches away from the hoop
                        three_arc = Arc((0,0), 475, 475, theta1=22, theta2=158, linewidth=lw, color=color)

                        #center court
                        center_outer_arc = Arc((0,422.5), 120, 120, theta1=180, theta2=0, linewidth=lw, color=color)

                        center_inner_arc = Arc((0,422.5), 40, 40, theta1=180, theta2=0, linewidth=lw, color=color)

                        #list of court elements to be poltted onto the axes
                        court_elements=[hoop, backboard, outer_box, inner_box, top_free_throw, bottom_free_throw,
                                       restricted, corner_three_a, corner_three_b, three_arc, center_outer_arc, center_inner_arc]

                        if outer_lines:
                            #draw the half court line, baseline and side out bound lines
                            outer_lines = Rectangle((-250, -47.5), 500, 470, linewidth=lw, color=color, fill=False)
                            court_elements.append(outer_lines)

                        #add the court elements onto the axes
                        for element in court_elements:
                            ax.add_patch(element)

                        return ax
The last step was to color the shot chart with wine for all the shots LeBron James has made and gold for all the shots he's missed. The Los Angeles Times did a similar graphic for Every shot Kobe Bryant ever took. All 30,699 of them. Fortunately, the Los Angeles Times also published How we mapped Kobe's 30,699 shots and published their code in GitHub.
#plot all the shots
            sns.set_style("white")
            sns.set_color_codes()
            all_shot_fig=plt.figure(figsize=(25,47),dpi=72)
            all_shot_ax=all_shot_fig.add_subplot(111)

            all_shot_ax.set_ylim([-100,840])
            all_shot_ax.set_xlim([250,-250])

            draw_court(ax=all_shot_ax,outer_lines=True)

            #first, draw the missed shots
            all_shot_ax.scatter(all_shots[(all_shots.EVENT_TYPE=="Missed Shot")].LOC_X,all_shots[(all_shots.EVENT_TYPE=="Missed Shot")].LOC_Y, color='#FDBB30', alpha=0.5)

            #then made shots
            all_shot_ax.scatter(all_shots[(all_shots.EVENT_TYPE=="Made Shot")].LOC_X,all_shots[(all_shots.EVENT_TYPE=="Made Shot")].LOC_Y, color='#860038', alpha=0.5)
Voila!

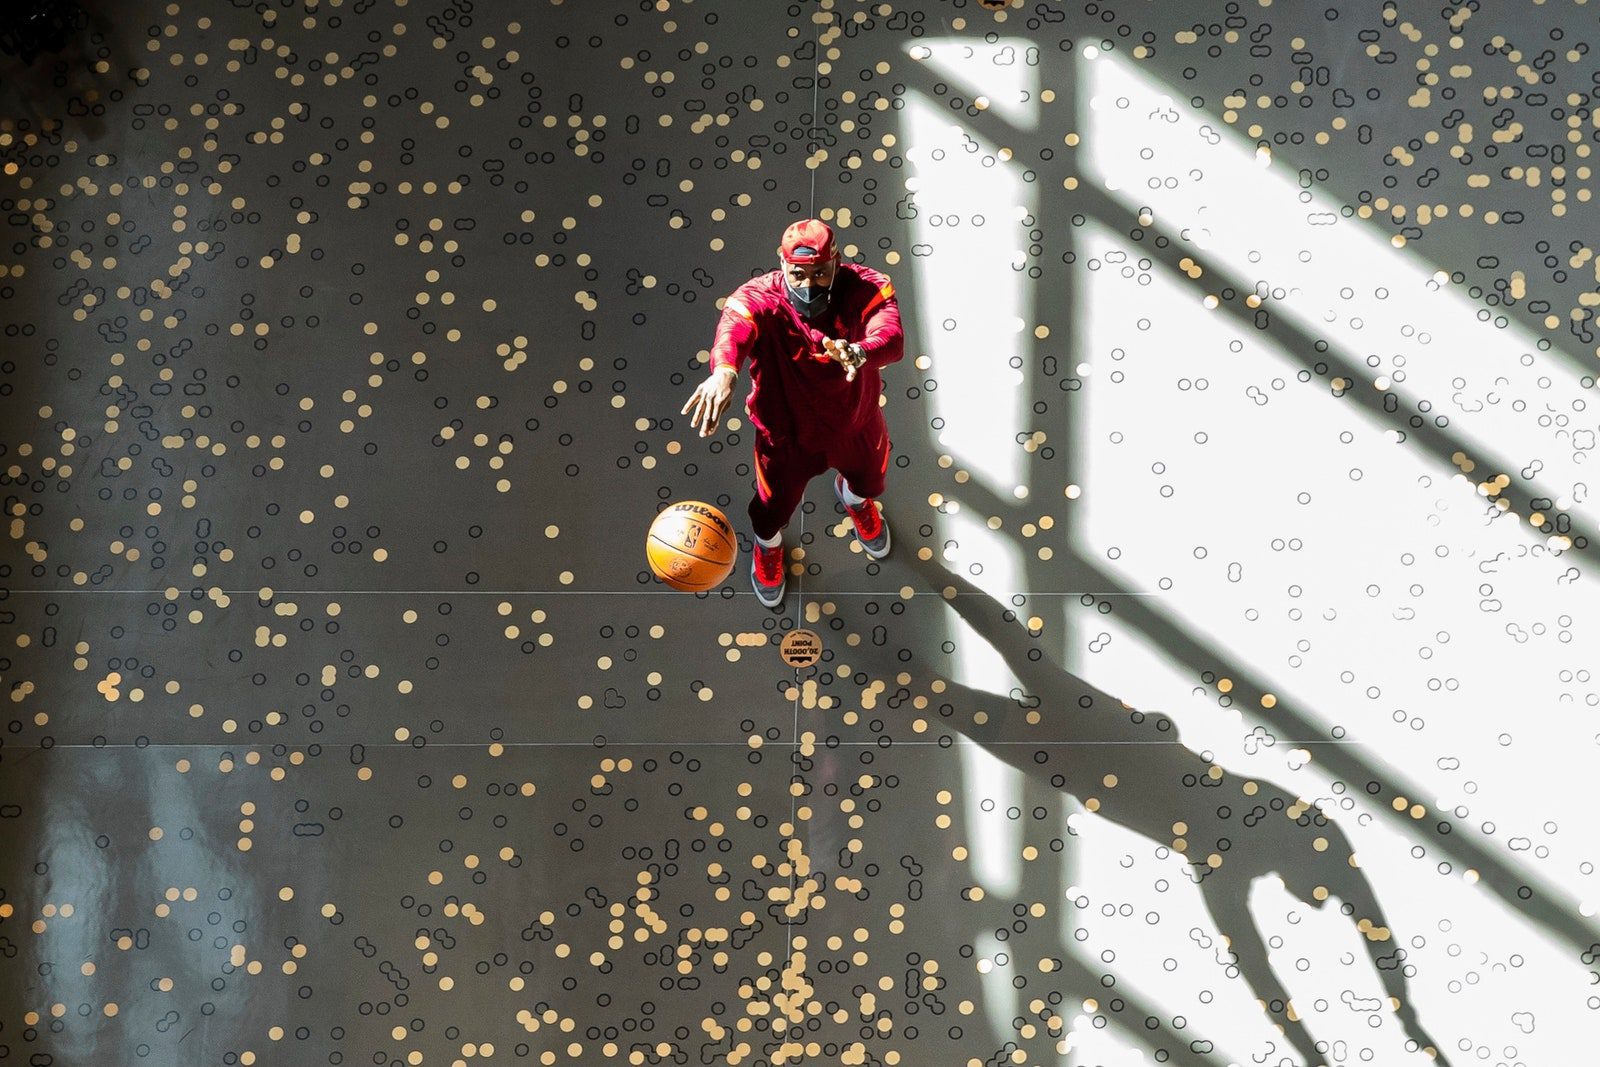
LeBron James Innovation Center
In February 2018, I received the following email from Nike:
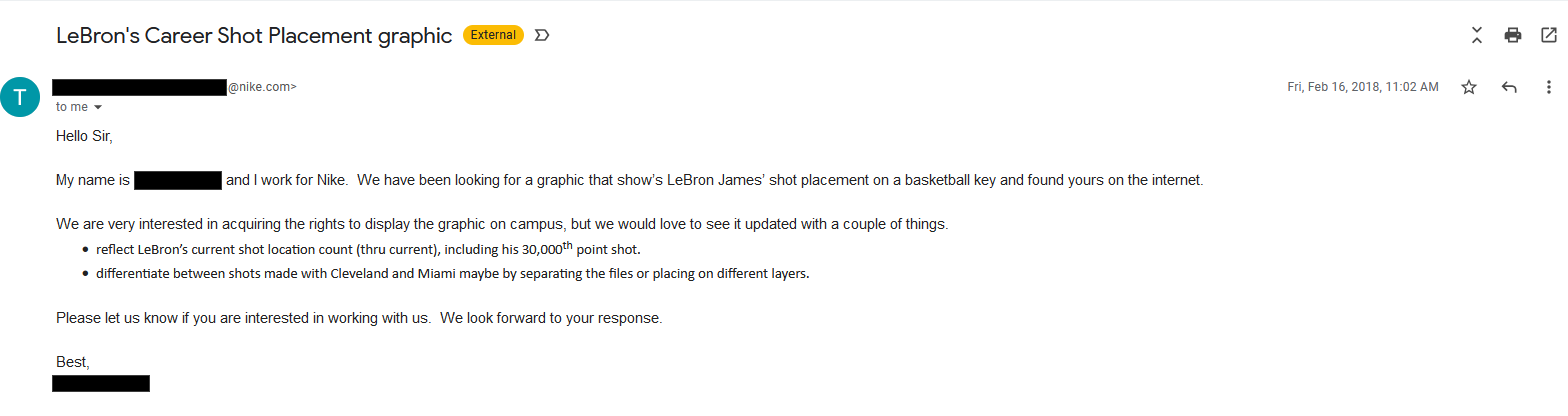
Obviously, I was interested in hearing what they had to say so we set up a call. In the call, Nike explained that they were planning to build a new building at Nike's headquarters named after LeBron James. They wanted to create a shot chart of LeBron James' shots in a basketball court inside the building. Apparently, they found this page from searching on the Internet for a LeBron James shot chart. By the end of the call, I agreed to help them create a shot chart of LeBron James' shots until the end of the 2017/2018 NBA season with the following shots highlighted:
- 10-29-2003: 1st NBA Shot Made (25 pts. vs. Sacremento Kings, set NBA record for most points scored by prep to pro player in debut performance).
- 3-20-2005: 1st NBA 50+ point game (56 pts. @ Toronto Raptors).
- 2-22-2006: 1st NBA Game Winning Shot (0.9 sec left vs. Charlotte Bobcats).
- 2-27-2007: 10,000th NBA Career Point (Youngest Individual to do so @ 23 years and 59 days vs. Boston Celtics @ Boston).
- 6-21-2012: 1st NBA Finals Championship Victory - Last Shot Taken (Game 5 vs. Oklahoma City in Miami. Triple Double, NBA Finals MVP).
- 1-16-2013: 20,000th NBA Career Point (Youngest Individual to do so @ 28 years and 17 days, vs. Golden State Warriors @ Warriors).
- 6-18-2013: 2nd NBA Finals Championship Victory - Last Shot Taken (Game 7 vs. San Antonio Spurs in Miami. Tied Tommy Heinsohn's record set in 1957 for most points in an NBA Finals Game 7 win).
- 3-3-2014: NBA Career High Game Point Total (61 pts. vs. Charlotte Bobcats).
- 6-19-2016: 3rd NBA Finals Championship Victory - Last Shot Taken (Game 7 vs. Golden State Warriors in Oakland. Led all Cavaliers with 27 points and became only the 3rd player ever in NBA history to record a triple double in an NBA Finals Game 7 by adding 11 assists and 11 rebounds. 5th player in NBA history to earn Finals MVP at least three times. Overall leader in points, rebounds, steals and blocks during the series, never before accomplished in any NBA playoff series. Helped to end 52 year sports championship drought for the city of Cleveland.
- 12-16-2017: 60th NBA Career triple-double – Last Shot Taken (vs. Utah Jazz, passed Larry Bird for sixth on career list).
- 1-23-2018: 30,000th NBA Career Point (Youngest Individual to do so @ 33 years and 24 days, vs. San Antonio Spurs).
In April 2018, I sent over the shot chart graphics. Several months later, Nike asked if I could update the shot chart with LeBron James' shots from the 2018 NBA Finals.
In November 2021, Nike announced the opening of the LeBron James Innovation Center designed by Olson Kunding, with this photo: